Urban Analytics Lab
About us
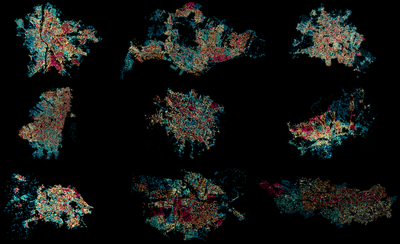
We are developing quantitative methods and tools that leverage emerging geospatial data and AI to sense the form, function, and human experience of cities.
Watch the video below or read more here.
Established and directed by Filip Biljecki, we are proudly based at the Department of Architecture at the College of Design and Engineering of the National University of Singapore, a leading global university centered in the heart of Southeast Asia. We are also affiliated with the Department of Real Estate at the NUS Business School.
News
Updates from our group

People
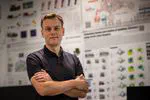
Filip Biljecki
Associate Professor
Matias Quintana
Research Fellow
Koichi Ito
PhD Researcher
Zicheng Fan
PhD Researcher
Xiucheng Liang
PhD Researcher
Sijie Yang
PhD Researcher
Kun Zhou
Research Assistant
Wenpei Li
Research Assistant
Juan Gamero-Salinas
Visiting Scholar
Yijie Gao
Graduate Student
Recent publications
Full list of publications is here.
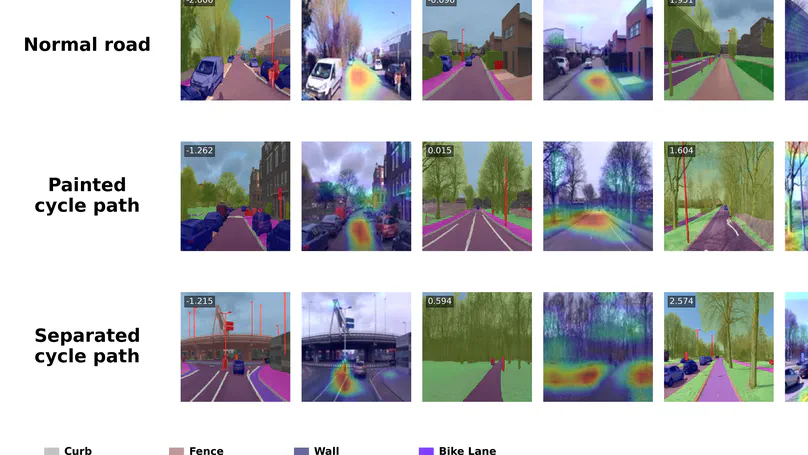
Perceived traffic safety influences cycling behavior, yet its value relative to travel time and other route attributes remains unquantified. Building on the stated choice experiment and street-level image dataset of Terra et al. (2025), we extract safety perception scores from cycling-perspective images using a computer vision model and estimate mixed logit models to test whether perceived safety affects route choice after controlling for visual street-level features. Cyclists are willing to accept 64 additional seconds of travel time for a one-unit increase in perceived safety (scale: very unsafe to very safe). Safety preferences vary across demographic groups: older cyclists, recreational cyclists, and those with positive cycling attitudes place more weight on safety, while commuters prioritize speed. These willingness-to-pay estimates enable planners to quantify perceived safety improvements for cost-benefit analyses and to score existing cycling networks for targeted infrastructure upgrades. (Replication code: https://github.com/koito19960406/cycling_safety_perception).
Contact
- [email protected]
- SDE4, NUS College of Design and Engineering, 8 Architecture Dr, Singapore, Singapore 117564
- X