Singapore's urban data affirms the compliance with the Circuit Breaker measures
Recent data reveals the way the COVID-19 pandemic unfolded, giving a cross-city understanding of the adherence to social distancing and its impact
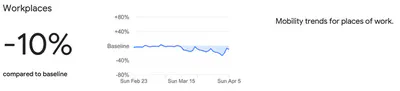
The news and social media have myriads of visualisations about not only the proliferation of the COVID-19 pandemic but also on how the measures to mitigate it have affected numerous aspects of daily life and the economy. These aid us to understand whether social distancing is taken seriously. The analyses presented focus mostly on the US, China, and Europe; and I have not seen much attention on Singapore, with the notable exception1 of Google’s Community Mobility Reports, and a couple of earlier comparisons with other cities relying on commercial data2. Here is an excerpt from Google’s latest report indicating the response to social distancing guidance:
Now that we have concluded the first week of the new stringent preventive measures (circuit breaker), I have analysed a few datasets and produced a couple of visuals to illustrate the current situation in Singapore with social distancing (a few words about the data and method are at the end of the article), and how Singapore compares to other cities around the world.
One of the most apparent urban aspects to look at is movement, as activities have been curtailed, and may directly suggest the compliance with the measures and social distancing guidelines.
Car traffic now, before, and… before then
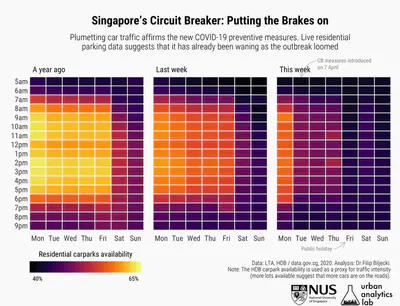
The first plot indicates the intensity of car traffic in Singapore in detail (by day and hour) over three periods: the first week of the circuit breaker, last week, and the same period the previous year. The data is derived from HDB carpark availability as a proxy for traffic (more about the data and rationale for this approach is given later). While it is interesting per se to see daily and hourly patterns during the ordinary times, it indicates a considerable drop during the first week of the CB measures. Unsurprisingly, the traffic plunged on the first day of the circuit breaker (Tuesday 7 Apr), and it is at the levels below a typical Sunday when the traffic is usually at its lowest point. Friday was the first public holiday during the circuit breaker, rendering a very notable trace.
The plot suggests that the measures are taken seriously. Moreover, the downward slope was already evident the week before the CB, as more people were taking precautions, e.g. working from home following the advisory of the Ministry of Manpower.
The next graphic similarly echoes the above analysis but from a different perspective, enabling an easier comparative view on the difference of the impact between the initial measures and the circuit breaker.
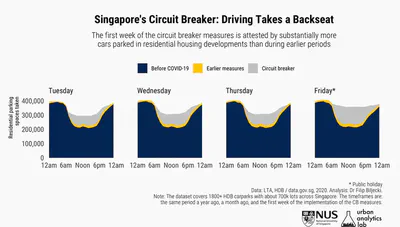
While Friday is not comparable to the previous Fridays, as it was a public holiday (Good Friday), an interesting insight is that it suggests that rarely anyone left their residence then, at least not by car (the number of cars parked during the day remained at almost the same level as the preceding night).
Leading to where we are now
The visual below includes a longer longitudinal daily trend since early December, before the pandemic started, illustrating the traffic until now and covering some key events in the timeline as the events unfolded. I also marked public holidays, when traffic drops regardless of the current events, to exclude these from consideration.
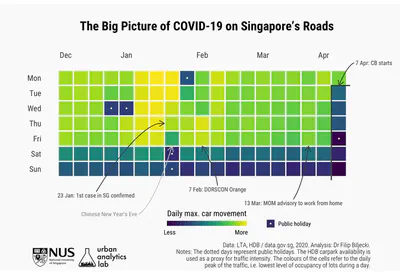
On 23 January the first case in Singapore was confirmed. The subsequent day the traffic plunged, but very likely due to the CNY Eve. Days in the following week were also probably affected by the festivities and more people being on leave, rather than the pandemic, in its early stage at that time.
On Friday 7 February, the Government raised the nation’s Disease Outbreak Response System Condition (DORSCON) level.
On Friday 13 March, the Ministry of Manpower issued an advisory, which states Where employees can perform their work by telecommuting from home, the employer must ensure that they do so. It appears that mid-next workweek the traffic visibly dropped.
What about public transportation
The above visuals reflect car usage (predominantly private car given that the focus is on residential carparks). Given that Singapore’s car ownership rate is among the lowest in the world and due to the highest cost in the world it is associated with income, the above might not be entirely representative of the entire population (although ride-hailing being prominent, the number of residents travelling is effectively higher than the car ownership rate suggests and should be more heterogeneous).
The only sufficiently detailed openly available dataset on public transportation I have found is the one released by Citymapper, as part of the Citymapper Mobility Index, hinting at the daily change of the city moving compared to the usual trends (the index is calculated by comparing trips planned in the Citymapper app to a recent typical usage period).
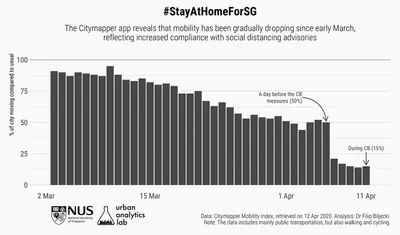
The app is used mainly for public transportation, but the data also includes walking and cycling. The data covers the period as of 2 March 2020. As expected, it also indicates a considerable drop as the Circuit Breaker measures were put in place, but also that social distancing guidelines were being taken seriously well before then. Good job, Singapore.
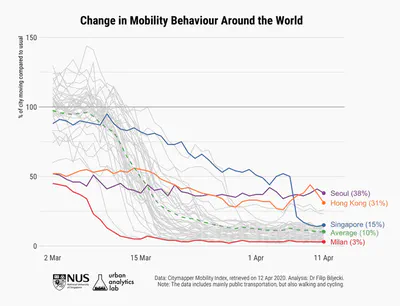
Comparison with global trends
The good thing is that the same dataset also covers 40 other cities around the world, enabling a comparison. How does Singapore stand with other cities? Looking at the rest of the world, life in Singapore continued at relatively fairly normal levels longer than elsewhere, with a gradual decrease (presumably reducing mobility only to essentials).
For a more detailed and separate overview of cities, the cities are plotted separately:
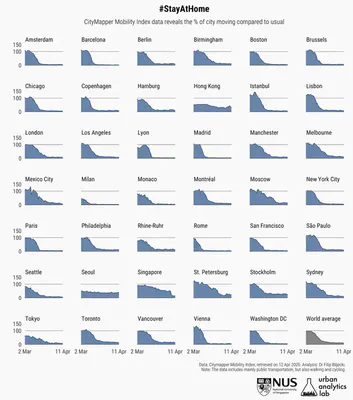
The above exposes cities that have either not implemented stringent measures, or where the rules are flouted.
Finally, the next one shows the change in the period of two weeks until 9 Apr (before the current weekend as Easter would bias the trend). It helps in understanding which cities have slowed down recently. Almost all of the cities have decreased mobility according to Citymapper data, or it remained at approximately the same levels where it already well decreased (the slight increase may be within the margin of error).
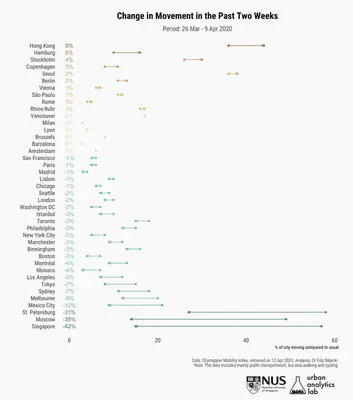
Singapore experienced the sharpest drop among all 41 cities. This may be good news as it indicates that people are taking the measures seriously, drastically changing their behaviour overnight.
Other urban aspects
Urban data is more than transportation data. For example, I also looked into air quality, but there does not seem to be a significant change so far. Some urban datasets will take time to become available, such as real estate transactions. They are left for another analysis in future.
Method
How were these data visualisations made? The data and tools used to create this analysis are entirely based on open (public) data and open-source tools. This section also includes a brief mention of alternative datasets that were considered, and may be subject of future analyses.
Data: car traffic
To the extent of my knowledge, there is no publicly available dataset on road transportation in Singapore, such as the number of cars currently on roads, so much has to be improvised and assumptions have to be made.
The Land Transport Authority provides several static and dynamic open datasets related to transportation. Among them, there is a resource with real-time travel times across quite a few roads in Singapore, distributed through their API as part of the LTA DataMall. This dataset may suggest the number of cars on the roads. However, it seems that the API does not allow querying historical data; it only returns the current situation, so past trends cannot be retrieved.
For this analysis, the carpark availability was used. The real-time data is available through the Carpark Availability API as part of the Data.gov.sg developer resources. The API returns live information about 2000 carparks in Singapore, managed by HDB, LTA, and URA, and for each, it returns the number of available lots, total lots, type of lots, agency in charge, and so on. It is refreshed every minute, and it allows retrieving carpark availability well into the past.
I considered only HDB carparks, to focus on the residential aspect. And I filtered out lots that are not for cars (e.g. those for trucks). Therefore, the data above presents a subset of all Singapore carparks/cars/traffic, but I believe that it is sufficiently large and representative enough to infer some pretty solid trends.
Carpark availability, in the absence of better data, should be a reasonably good proxy for movement of people by car. Sure, there are disadvantages and limitations to this approach. For example, a resident can leave their residence to enter the carpark at their friend’s estate, resulting in a net zero record while they moved, but on a large scale it nevertheless gives confidence that it suggests movement in a relatively accurate manner to get a good picture of the use of cars.
About the second plot, showing the absolute number of parked cars, in comparison with the earlier year, one may argue that there are more lots taken now because the car population grew (there is no publicly available data for 2020 yet to confirm this). However, given the recent freeze of the number of private vehicles in Singapore, I doubt that the car population changed notably, if at all.
Data: transit
The Citymapper Mobility Index mainly reflects public transport, but the app is also used for walking, cycling, and some micromobility and cabs. It does not differentiate different transportation modes, and as Citymapper highlights, it represents a subset of general mobility. Thus, there may be some deviations to the real world. A disadvantage of the dataset may be that the usual trends also include tourists, not only locals. Therefore, a drop in mobility might reflect not only the compliance with social distancing measures but also a drop in tourist arrivals.
Regarding public transport, LTA provides the Origin-Destination data at the LTA DataMall for both bus and MRT, but it is rather on a monthly basis, without a breakdown by day. It will undoubtedly be useful to check it out once data for March and April are revealed, to get some general trends at least.
Also, well worth mentioning in this context is the URA’s Space Out — released a week ago — providing regular updates on the crowd levels in malls across Singapore. The data does not appear to be available for download, but the website may provide some insights into the change in the footfall in malls.
Tools
The data was processed, transformed, and visualised using
and ggplot2.
The used theme is from the package hrbrthemes, with some modifications.
Acknowledgements
Both datasets used are gratefully acknowledged.
Update
Some of the plots in this article have been updated two weeks later in a new post using the latest available data.
#StayHomeForSG
There are though many visualisations about the spread of virus, cases, hospital discharges, etc. For example: there is a dashboard of the outbreak in Singapore . ↩︎
Straits Times: Public transport usage plummets as more stay home, 26 Mar 2020. ↩︎