Impact of the pandemic on bus ridership in Singapore
Research conducted by our Master of Urban Planning students offers public transport optimisations
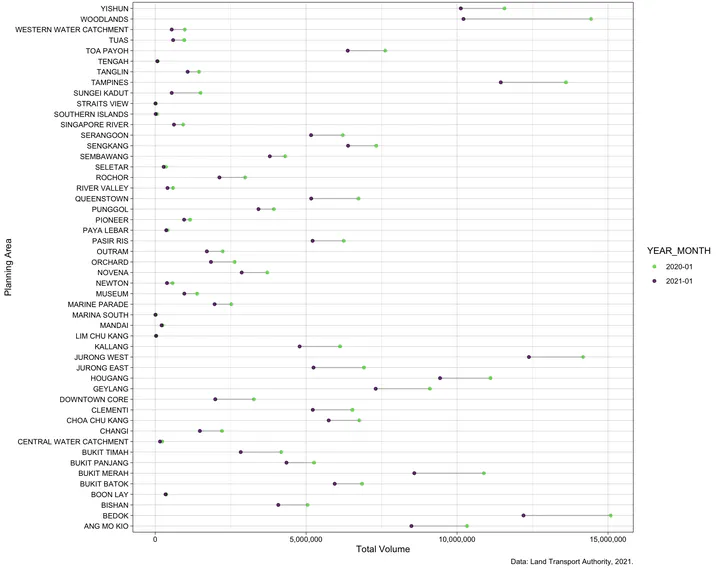 Change of total bus passenger volume by planning area over one year (early 2020 vs early 2021).
Each year, Master of Urban Planning students taking the module DEP5111 Planning Technologies carry out group projects to demonstrate the attained data science skills and apply them in the urban context.
The article below features one of the projects completed in this semester by Chen Bingling, Liang Xiucheng, Liu Lina, and Wen Ruiwen.
This final group project was finished in early April 2021, focusing on the comparative analysis of public transportation (bus) passenger volumes just before the onset of the pandemic and the introduction of the safety measures (January 2020) and a year later, several months after many of the restrictions were progressively lifted.
Each group project, including this one, was carried out entirely using open data and open-source software.
We thank all the students in the class for their interesting projects.
Abstract
The COVID-19 pandemic greatly impacted cities around the world in various aspects, e.g. resulting in the decrease of public transportation ridership. This study investigates the influence of COVID-19 on bus travel behavior across different land uses and planning areas in Singapore, and analyzes the bus stop recovery rate using an evaluation model. According to the data available at the time of the analysis, 92% of bus stops have not yet resumed to the stage of January 2020 in terms of passenger volume. The study reveals some notable results, e.g. after the strictest measures were lifted in June 2020, Marina South and the Southern Islands exhibited a sharp rise in traffic in July 2020. Nevertheless, in comparison with other planning areas, these locations still have a low recovery rate presumably partly due to the loss of international visitors. In relative terms, the residential areas tend to have a better recovery performance. However, the institutional and business related land uses are still under the expected lines, partially because a large portion of the population has transitioned to working and learning from home. The results also suggest an inverse relationship between the share of residents living in private housing and the recovery rate of bus passenger volume at the scale of a planning area.
 on [Unsplash](https://unsplash.com/s/photos/covid-singapore-bus).](/post/2021/05/31/impact-of-the-pandemic-on-bus-ridership-in-singapore/shawnanggg-UmxIsHNZvTs-unsplash_hu_30234df6cf449938.webp)
Background
Starting in April 2020, circuit breaker measures have been implemented in preventing further spread of COVID-19. The measures were beneficial and successful, but as everywhere around the world, they had an impact on transportation. The Land Transport Authority reported that average daily ridership for buses and trains fell by 34.5% – an 11-year low1. The city-state was not alone in experiencing plummeting ridership, e.g. in Washington DC, metrorail, bus ridership declined by 75%2; in London, the usage of public transportation dropped by 40%3.
The aim of this study is to understand the changes of bus ridership over the period of COVID-19 and to what extent has people’s movement recovered from the pandemic. The analysis focuses on Singapore’s planning areas and land use, and it also analyzes relationships with demographics.
Data and Method
This study is conducted by investigating the passenger volume changes by months in 2020 and other factors such as land use and the characteristics of planning areas. Based on the comparison of the passenger volume and flow direction in January 2021 with the same period of 2020, an evaluation model of passenger volume recovery for each bus stop is built and implemented to identify the changing behavior of bus ridership. It also aims to discuss the implications for future planning of bus stops and transport networks.
There are two key data sources used in this analysis: (i) origin destination data from the Land Transport Authority; and (ii) Land Use and Planning area boundaries according to the Master Plan of the Urban Redevelopment Authority. Further, the demographic data by the Singapore Department of Statistics has been used to attempt to associate the change in public transport ridership with demographics.
In brief, we first calculate and aggregate the passenger volumes by land use and planning area according to a 50m buffer around each bus stop, and observe the general trends. Afterwards, we calculate the rate of change in total passenger volume (sum of tap-in and tap-out) related to the previous month and its change rate.
Results
Planning area and land use type change rate by month

In Figure 1, we summarize the rate of change of passenger volume in each planning area and visualize with heatmap. There is a visible change during and after the period April-May 2020 when the most stringent measures were in place. Marina South and Southern Islands exhibit explosive growth in volumes in July 2020.
Using the same method, we calculate the change rate of land use.
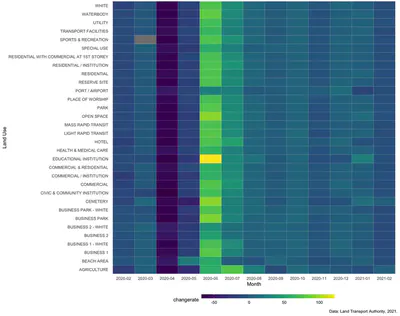
In Figure 2, bus stops associated with the land use of Beach Area (according to the URA Master Plan) have taken the lead in a positive upward trend of total passenger volume in May 2020. These are mostly locations close to residential areas (e.g. East Coast Park), and it can be assumed that residents preferred close seaside parks for leisure activities during Phase I.
In the meantime, the Educational Institution land use exhibited the most significant increase while the Port/Airport only showed a slight increase in June 2020. This phenomenon can be explained by the large number of students resuming class while many jobs are still in the work from home mode, and obviously because of the severely restricted international travel.
Period-over-period comparison of total passenger volume and traveling direction
We worked on understanding how the mutual flow of passengers has changed between land uses using the Sankey diagram. Considering that land use types with small absolute values of flow rate will show thin lines that are difficult to distinguish, 11 land-use types with large passenger flow rates are chosen here for graphical representation, for each period separately.
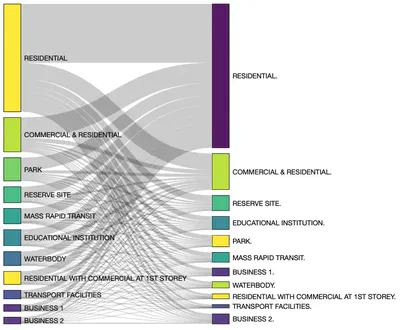
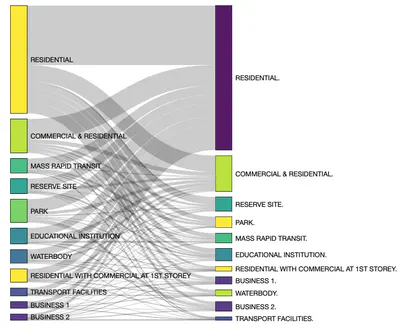
Comparing Figure 3 and Figure 4, we can see that the volume flowing from residential to transport facilities decreases, the volume flowing from park to business2 increases significantly, and the flow from commercial to business decreases remarkably.
Next, we compare the total passenger volumes by planning area of Jan 2020 and Jan 2021.
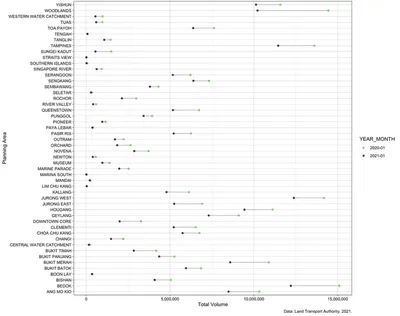
Figure 5 suggests that Yishun and Bukit Batok, which are predominantly residential areas, have a smaller difference in total trip value than Woodlands and Bukit Panjang in comparison to the same period last year, and have shown better recovery rates. Meanwhile, Kallang, Jurong West, Jurong East, Houguang, and Geylang, etc. show a similar trend. It is assumed that the demographic structure of the area may have some influence on the degree of traffic volume recovery.
Recovery performance
Recovery performance analysis by bus stop, land use and town
The recovery performance of bus stops is defined by the ratio of the total passenger volume in January 2021 to the total passenger volume in January 2020. Firstly, we calculated the recovery rate of each bus stop and observed the overall distribution through density graph.
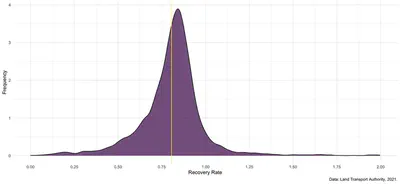
Figure 6 indicates that the recovery rate of 92% bus stops is below one, meaning that by Jan 2021 their total tap in and tap out volume has not recovered to the levels in Jan 2020, before the pandemic. The recovery rate of most bus stops concentrates between 0.625 and 0.875, and some bus stops experienced more severe loss in passenger volumes, with their recovery rate below 0.5. Dividing the total trips of each bus stop into different land use and planning areas according to their land area percentage of the 50m buffer area, we are able to calculate the recovery rates of different land use and planning areas.
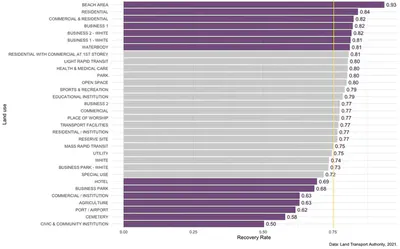
In Figure 7, the recovery rates of all land uses, except for beach area are below 0.625, and it is clear that residential as well as industrial related land use tend to have better recovery performance, while some institutional or tourism related land uses, such as airport or hotel, unsurprisingly still have relatively low recovery rates. The recovery rates of educational institutions, commercial and business parks are not as high as expected, which may be explained by the work from home guidelines. These institutions and their staff have more or less adapted to remote working or learning mode, so they tend to adopt a cautious attitude even if the pandemic has eased.
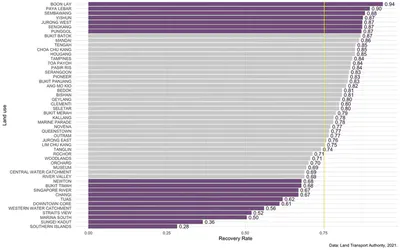
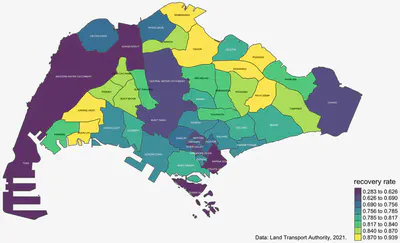
Moving to planning areas, it is indicated in Figure 8 and Figure 9 that there are stark differences in the recovery rate of different planning areas, ranging from 0.283 to 0.939. Hit by the decrease of tourists, Southern Islands (i.e. the planning area in which Sentosa is located) has the lowest recovery rate, while new towns with a large percentage of residential land use, such as Punggol, Paya Lebar, and Yishun recovered faster than other towns.
Besides land use, we analyze whether socio-demographic features may explain the variances of recovery rates across different towns. We joined the data of age (share of seniors), gender ratio (share of female population), population density, as well as the percentage of residents living in private housing, and computed correlations.
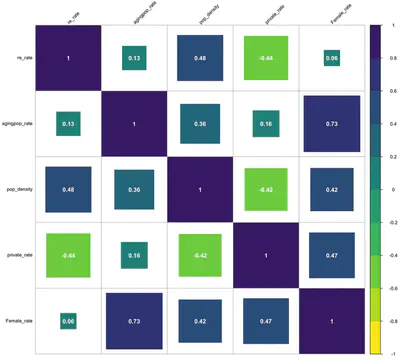
The results in Figure 10 suggest that population density has the most significant impact on recovery rate, and the more populated a town is, the faster it may recover from the pandemic in terms of bus stop passenger volume. The percentage of residents living in private housing has a moderate negative correlation with recovery rate, possibly because other private transport modes are more accessible to the residents in planning areas with more private dwellings.
Recovery performance evaluation and adjustment recommendation of bus stops
Combining the results of recovery rates of planning area, land use and each bus stop, as well as the their mutual flow of passengers, we are able to conduct a bus stop recovery performance evaluation. Each bus stop was given a categorical score (from A to E) to indicate its overall recovery rank based on the aforementioned aspects. We visualized the bus stops and their ranks in the map and observed the spatial relationships.
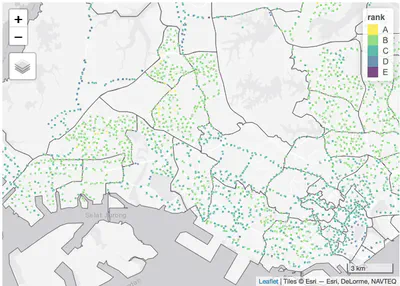
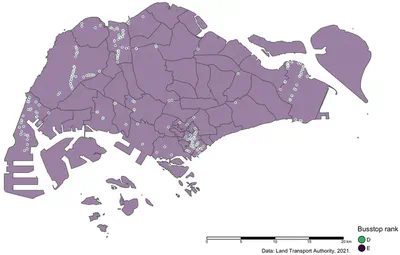
Figures 11 & 12 show that bus stops of rank A or B are more equally distributed, while bus stops of rank C or D seem to concentrate in areas such as CBD, Bukit Timah and Tuas. Areas with a notable share of bus stop of A and B ranks could well preserve and maintain the existing bus stops, while areas with high concentration of bus stops of D and E rank could be considered to combine some of the bus stops or adjust their locations until the impacts of the pandemic are relieved.
Conclusions
In this exercise, we observed how the pandemic has influenced public transit behaviours in terms of both robustness and resilience. As almost everywhere around the globe, measures introduced to combat the pandemic have greatly influenced people’s transit travel behavior, as shown by the rate of change in planning area and land use. In terms of robustness, we found that certain land use and planning areas experienced the most severe strikes in passenger volumes during May 2020 and July 2020, when the pandemic and the restriction reached their peaks. The locations where people tend to travel to by bus have also changed, as shown by the change in the ranking of destination land use types.
In terms of resilience, we found out that the total bus trips have not yet returned to the pre-pandemic level in all planning areas as well as land uses, in spite of some differences in their recovery rate. Therefore, as an urban planning exercise, we conducted a recovery performance evaluation on bus stops.
Limitations
This analysis is not without limitations. The most important ones are:
- We assumed that all changes in bus trips were the effect of the pandemic and did not fully consider other factors, such as the bus operator’s own adjustments to stops and routes, and other factors that are simply unrelated to the pandemic and measures.
- We gave the same weight to all site types, and the passenger volume to each site was assigned with the proportion of the footprint of the site type within the service radius, without taking into account the relatively higher possibility of land use like commercial and residential as travel destinations in real life, so the results may have some deviations from the actual outcomes.
- In the correlation analysis of the factors influencing the recovery rate in the region, the amount of data that can be used is limited and the sample size is relatively small, so the correlation coefficients may not be entirely indicative.
Acknowledgements
This student project was carried out as part of module DEP5111 Planning Technologies in the Master of Urban Planning, which is conducted by the NUS Urban Analytics Lab. The open data sources by LTA, URA and SingStat used in this analysis are gratefully acknowledged.
Further reading
If you find this article of interest, have a look also at our April 2020 analysis using carpark data.
Tan, C. (10 February 2021). Bus, train ridership in Singapore falls to 11-year low amid Covid-19 pandemic. The Straits Times. ↩︎
WMATA. Metro and Covid-19: Steps we’ve taken. 2020 [accessed on 2 April 2020]. ↩︎
Harrabin, B.R. (25 April 2020). Coronavirus: Transport usage will change after lockdown. BBC News. ↩︎