A Graph-Based Human-Centered GeoAI for Understanding Street-Level Environment and Traffic Accident Frequency with Street View Imagery
Abstract
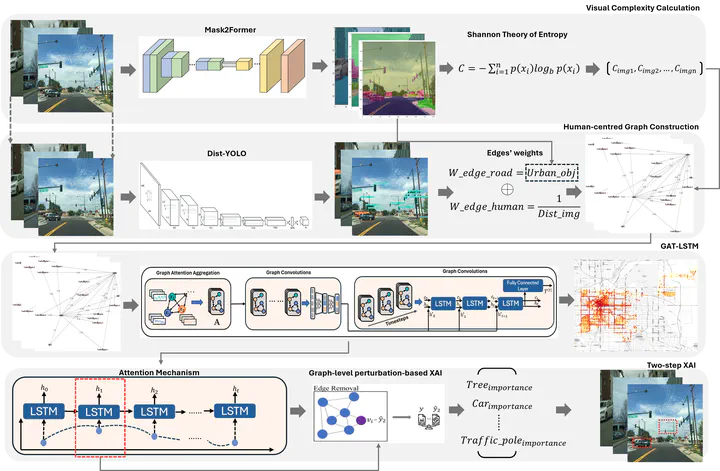
Traffic accidents are a major global concern, highlighting the need for advanced traffic analysis and predictive techniques. The emergence of crowdsourced street view imagery (SVI) platforms has transformed public participation in collecting urban data, initiating the development of human-centered traffic analytics. This article investigates the relationship between visual urban understanding derived from Mapillary SVI and the frequency of urban traffic accidents. We analyzed SVI’s visual complexities using the Mask2Former image segmentation model and provided spatial reasoning of the urban objects (e.g., cars, buildings, trees) by estimating visual distances between those objects and the drivers using Dist-YOLOv5. These distances were encapsulated as edge weights, with urban objects and the drivers as nodes, creating human-centered graphs at each SVI location. We propose a framework that integrates a graph-based deep learning approach, GAT-LSTM, to capture the spatial-temporal dynamics of these urban objects for modeling traffic-accident frequency. Our results indicate that this model outperforms a traditional machine learning method by over 70 percent in mean absolute percentage error (MAPE) and demonstrates superior performance compared to other deep learning-based methods. Additionally, we introduce a two-step Explainable AI (XAI) method to identify key factors associated with roads with higher traffic accident rates, thereby improving the interpretability and practicality of our research for understanding the urban safety environment.

Pengyuan Liu
Research Fellow

Winston Yap
PhD Researcher

Yujun Hou
Research Associate

Binyu Lei
PhD Researcher